CSR Progress Highlights
We made important progress from 2012-2016, reducing energy use and CO2 emissions, contributing to local communities, and investing in infrastructure, technology, people development, and systems to drive even further environmental improvements.
2012-2015 Progress Highlights
-
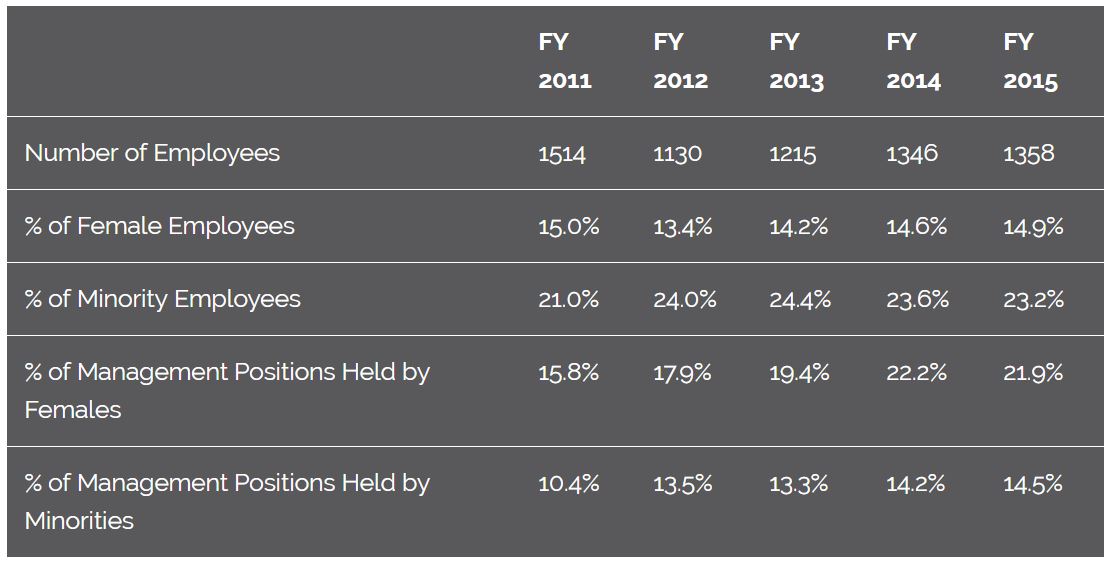
People
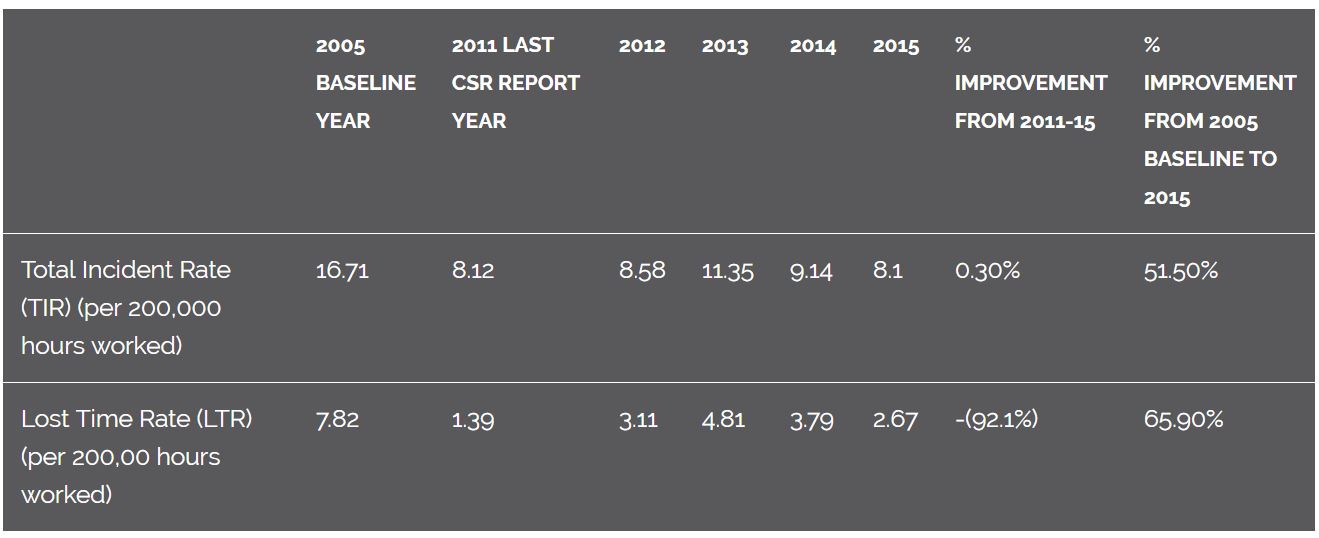
Safety
-
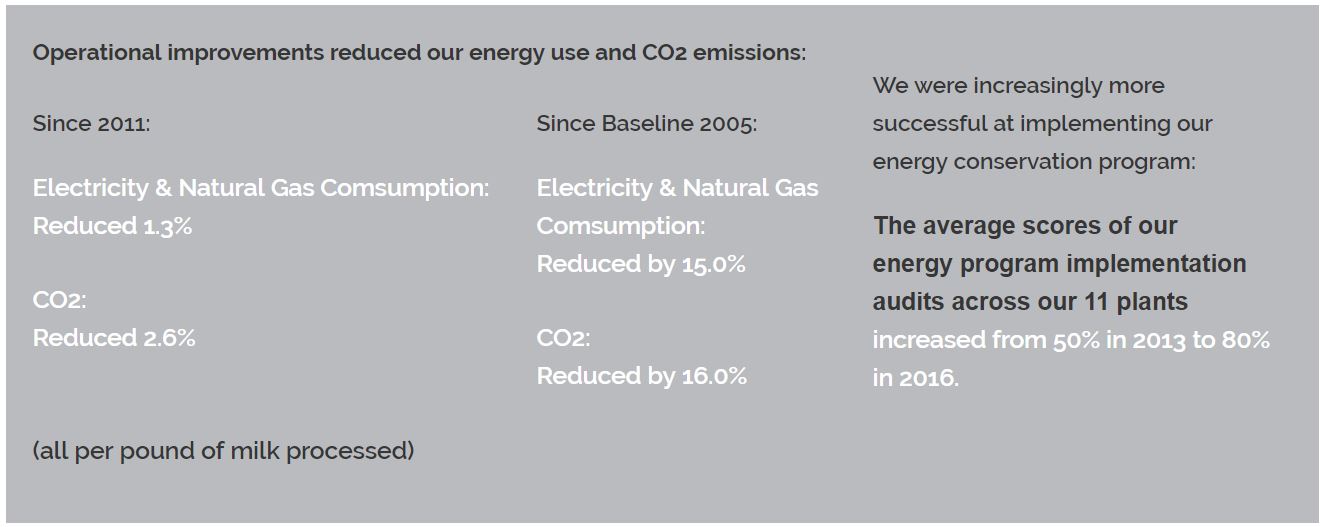
Operations
-
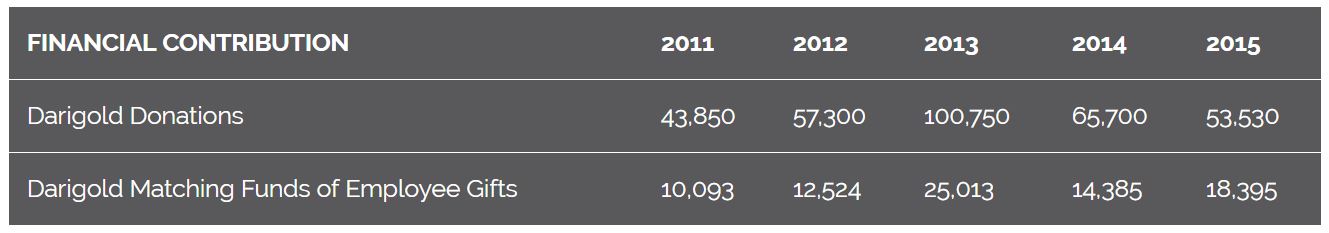
Community